Lesson overview:
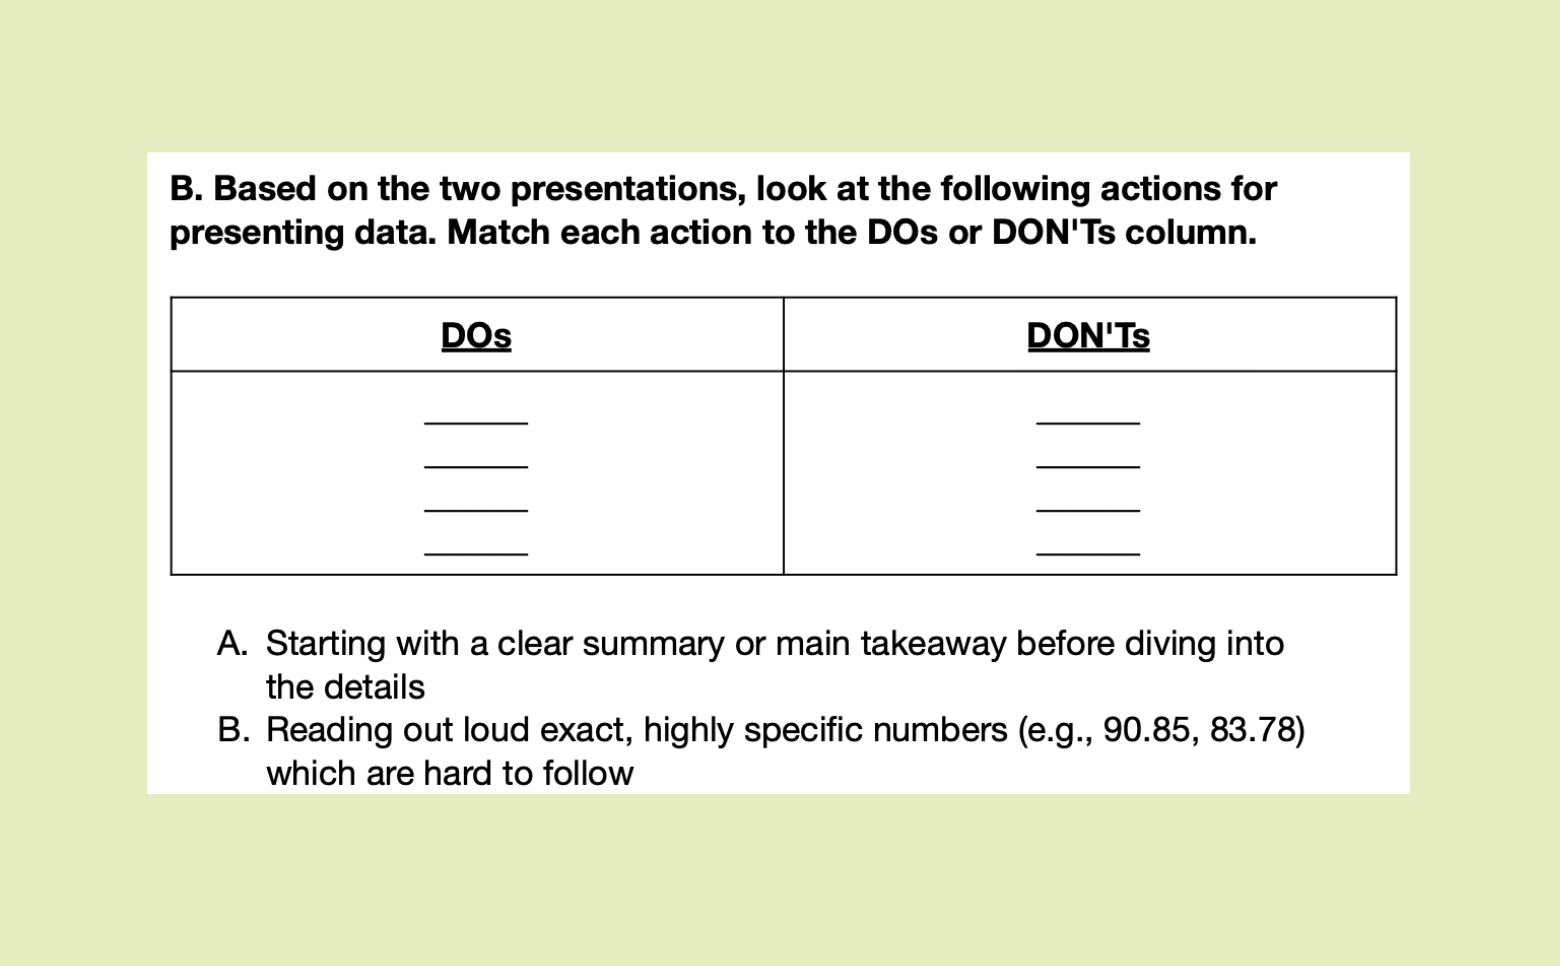
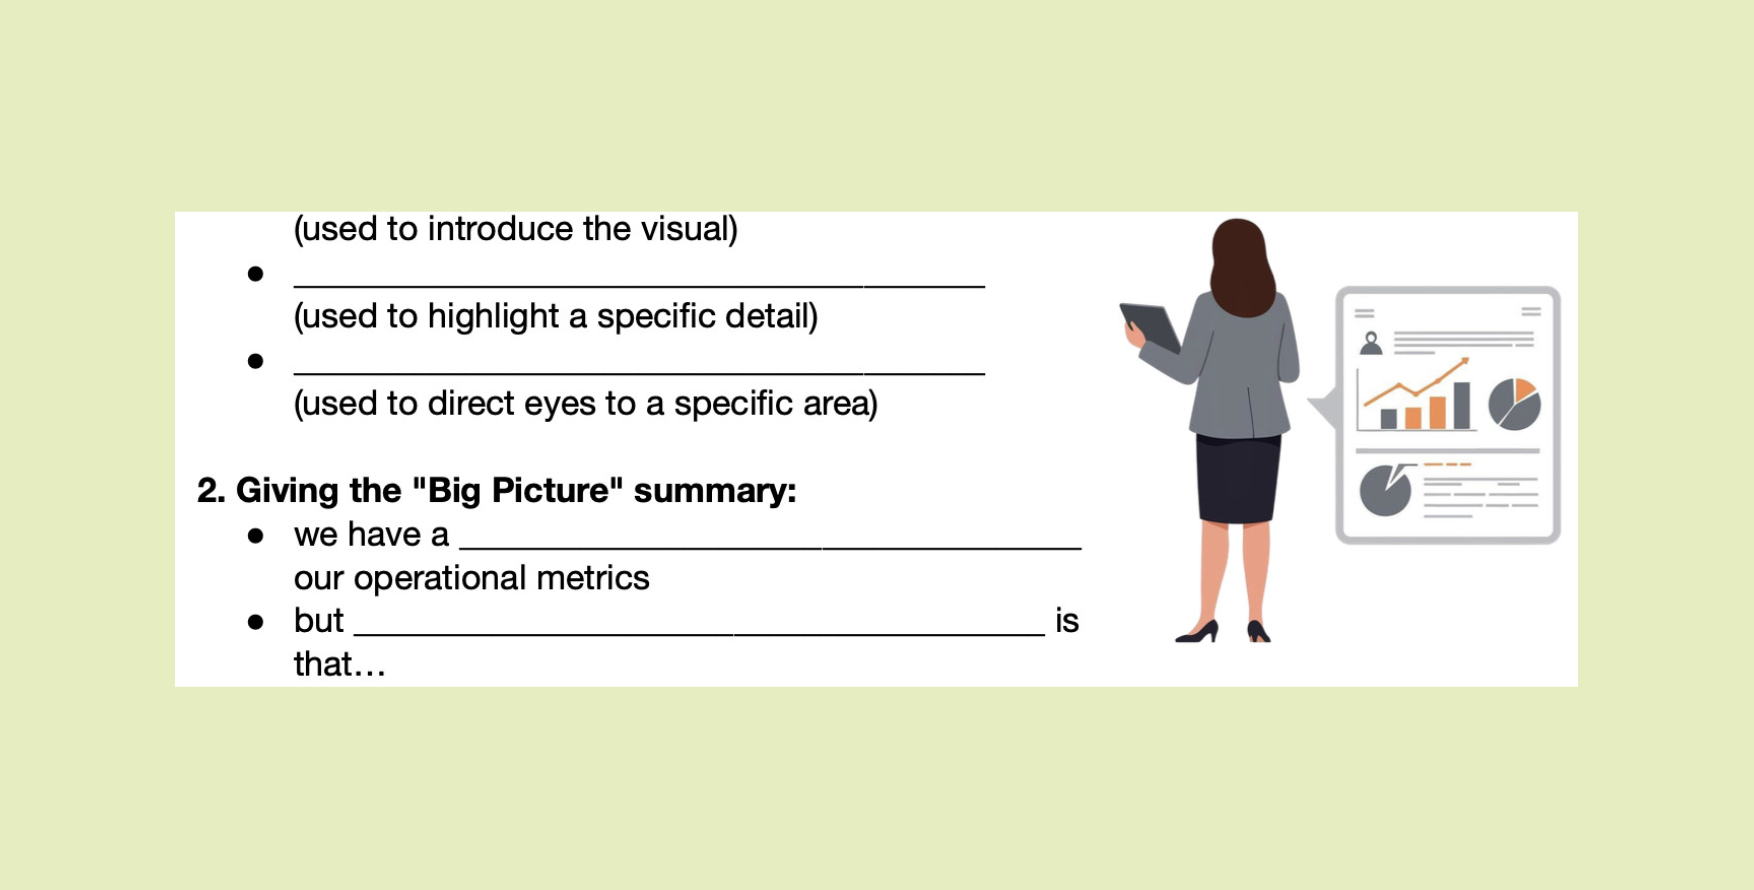
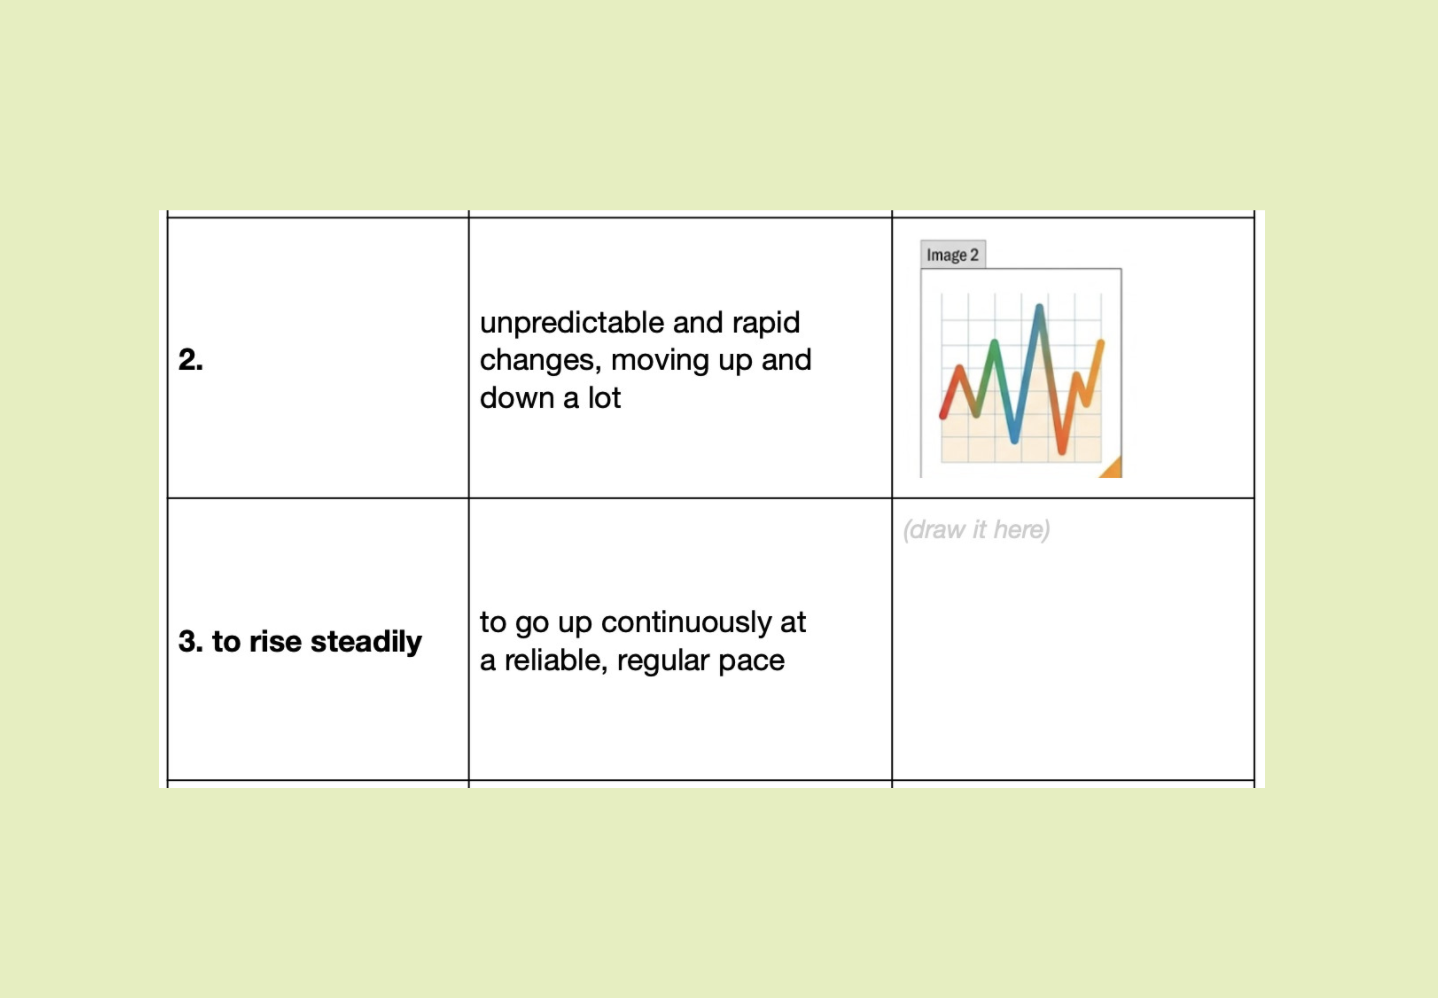
This Business English lesson helps students turn raw data into a clear, audience-friendly presentation. They compare effective and ineffective ways of presenting charts, learn language for trends and approximations, and practise signposting key information. Students then move from controlled chart descriptions to short boardroom-style presentations where they explain what the data means and suggest next steps.
By the end of the lesson, students will be able to:
- describe common trends and changes in charts accurately;
- guide an audience through data using clear signposting language;
- summarise key findings and explain their business implications.
Lead-in:
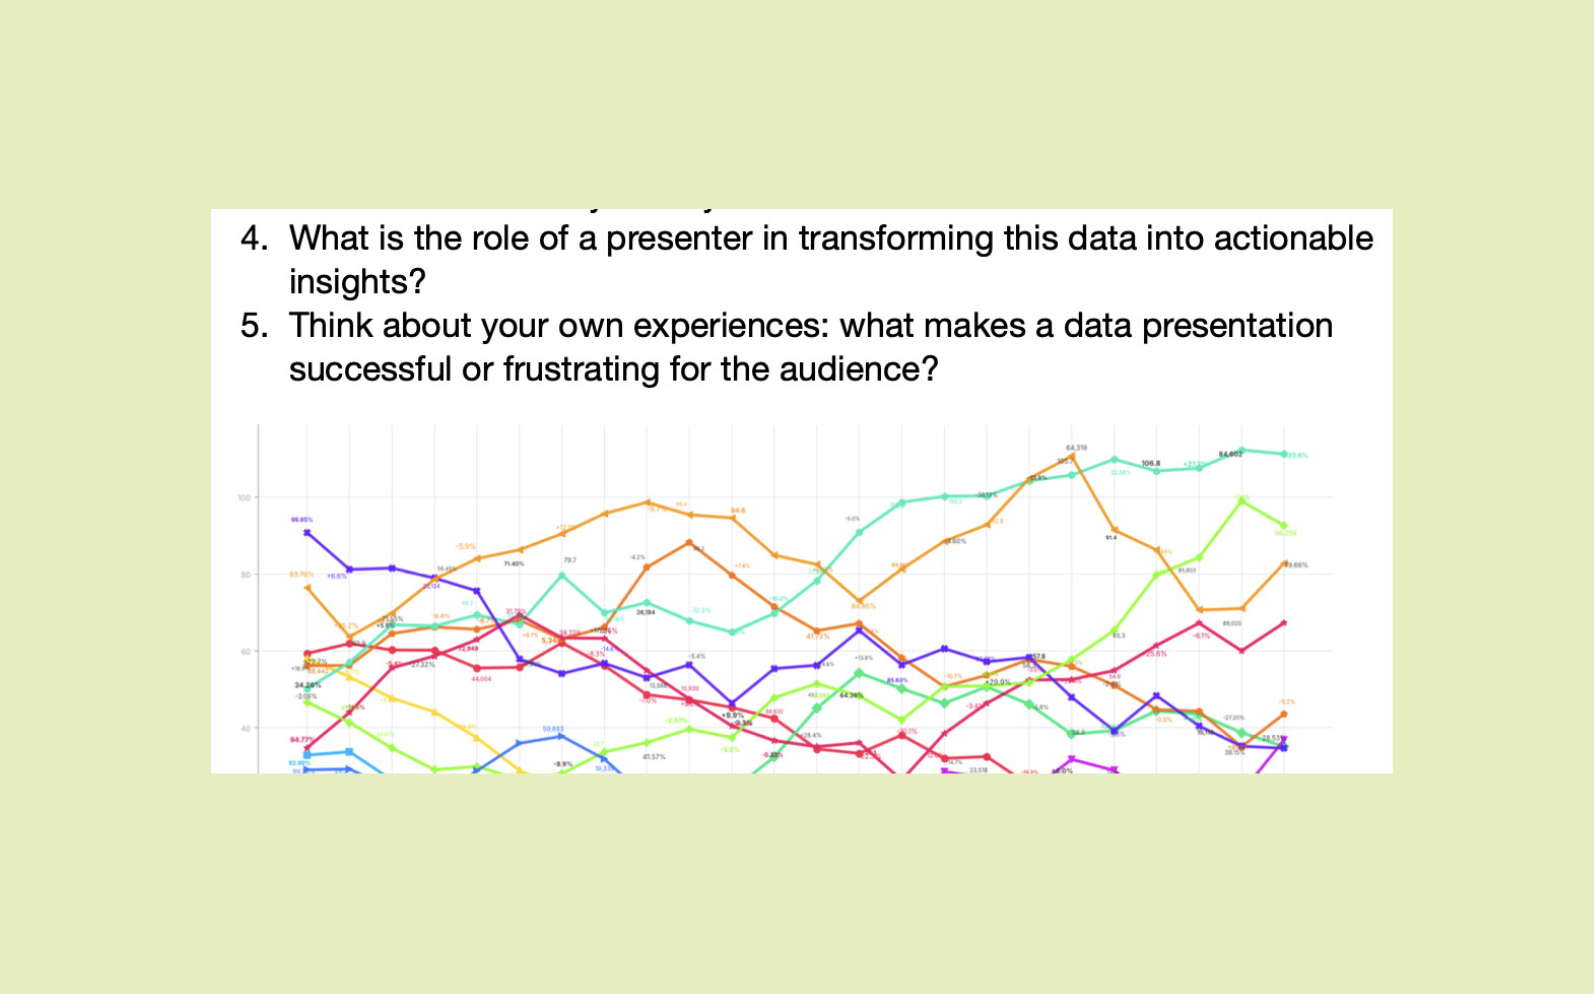
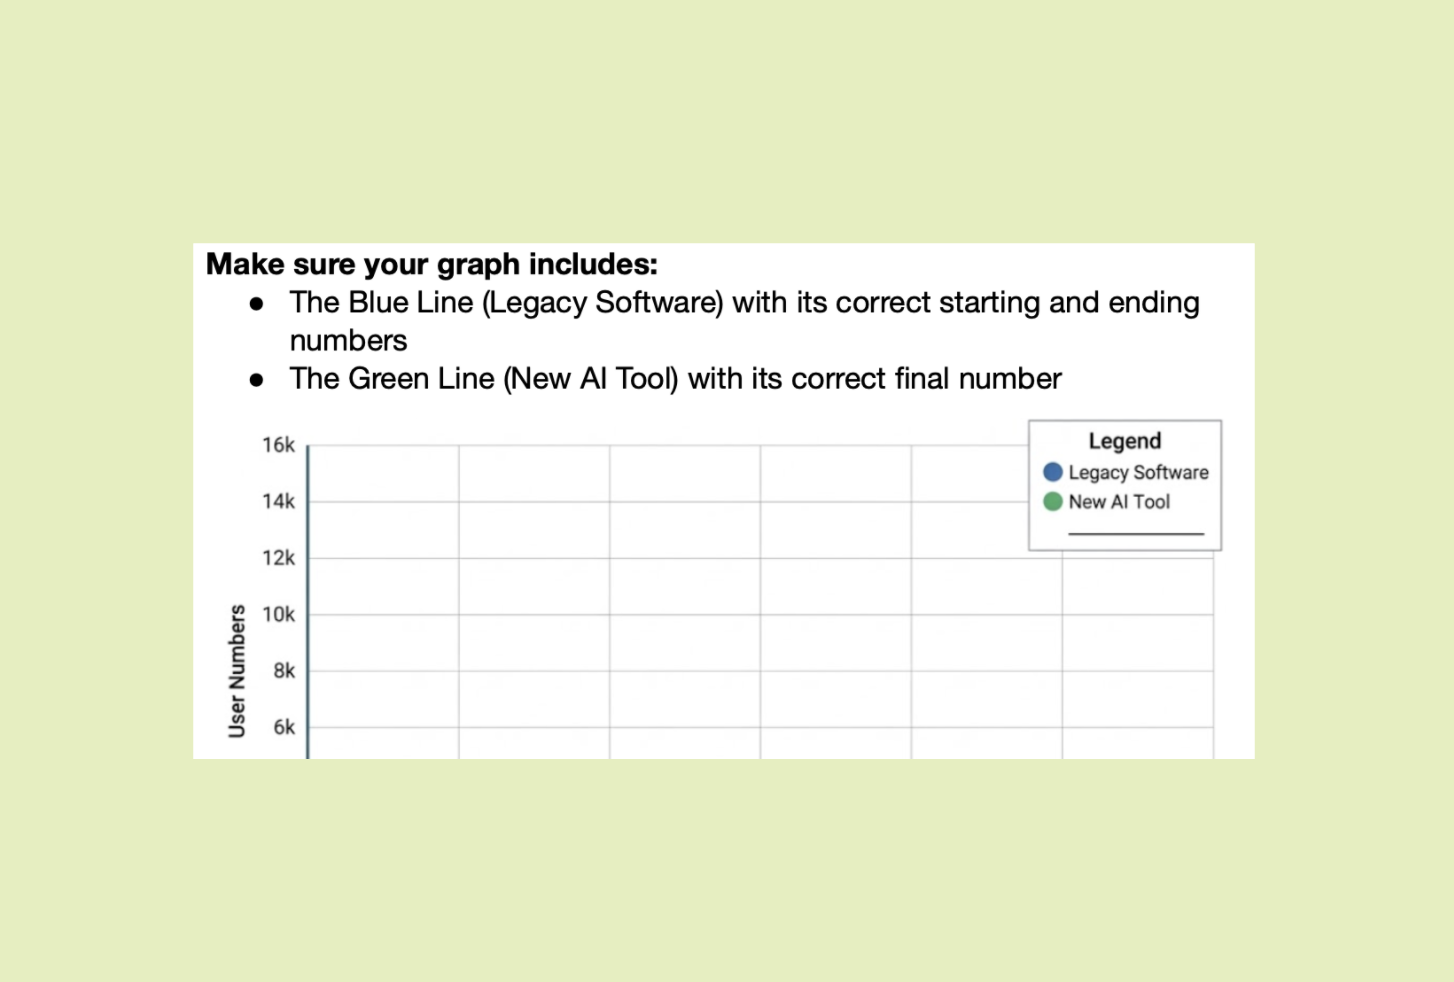
Students begin with a deliberately cluttered graph and discuss whether raw data is useful without interpretation. They reflect on their own experience of presenting figures and consider the presenter’s role in turning complex information into clear, actionable insights for clients or stakeholders.
Teaching Tips
We've added a few helpful tips where they're most needed—just little nudges to make your lessons run more smoothly. Whether it's setting up a task or tackling a tricky grammar point, these suggestions are here to make your teaching life easier.
Add it to a class plan and keep track of what you've taught.